Biosignal Sensing to Support Learning
Overview
In this project, we built a framework for understanding cognitive-affective states in Kindergarteners and presented applications for the framework in classrooms.
Cognitive–affective states during learning are related to the mental effort of the learner or the cognitive load imposed on the learner. By triangulating the data obtained from observations, physiological markers, self-reports and performance as they performed tasks of varying mental effort, we can attain deeper insights into these states than just looking at performance scores.
Role
I assisted the project’s lead, Priyashri Sridhar, in:
- Data analysis of video recordings during the cognitive tasks using Microsoft Emotion API, cloud-based machine learning algorithm for emotion estimation from face images
- Creating graphs and visualisations to present performance scores, physiological data, emotion estimation data and overall findings
- Writing and editing the conference paper and journal article for the project
Process
Behavioural and Emotional Data Analysis
Background
We wanted to explain the framework through a combination of observational, physiological and performance data from two case studies (two children).
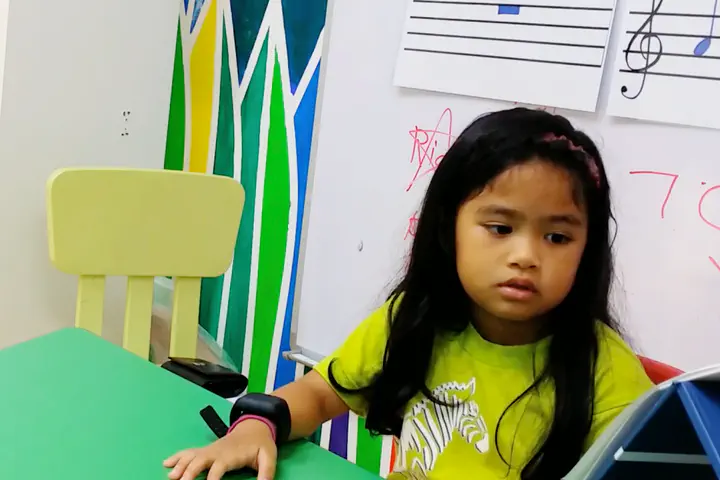
Video recordings were taken while the children were performing cognitive tasks of increasing mental effort to provide us with the observational data. These recordings were manually coded by two researchers for behaviours and facial expressions (emotions).
However, such manual methods would be difficult and time-consuming to apply for a larger group of children, such as in a classroom. Thus, we aimed to explore the possibility of deriving these emotions computationally and integrating it with the rest of the data from the physiological sensors.
Analysing Emotion from Video
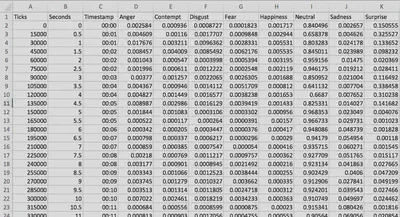
From my review of existing tools for attaining emotion estimation from video, I selected Microsoft Emotion API (now part of Microsoft Face API) for its accuracy and ease-of-use. It could analyse emotions from photos and videos to give confidence scores (from 0 to 1) for the presence of eight emotions: Anger, Contempt, Disgust, Fear, Happiness, Neutral, Sadness and Surprise.
I built the application from the Windows SDK for the Emotion API using Visual Studio 2015 (C#). It was modified to log the resulting confidence scores for each emotion over time from the two case study video recordings into .json files.
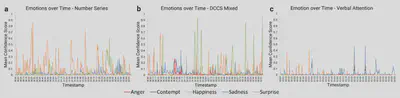
The logged data from the .json files were formatted to tables in Microsoft Excel. By checking the files and the API documentation (now deprecated), I found that the Emotion service analysed emotion from video frames at an interval of 15000 Ticks. A Tick was a measurement of time defined by the API system. This was converted into Seconds by dividing Ticks over the Timescale (30000 Ticks): Seconds = Ticks/30000. Timestamps were calculated via the formula: Timestamp = Seconds/86400 and formatting the values to ‘mm:ss’ custom format. This made it easier to sync the timestamps of the emotion confidence scores with video and sensors data for further analysis. Figure 1 shows the resulting data in Excel and Figure 2 shows an example of the emotions over time plots for three cognitive tasks.
Visualisations for Combined Analysis
To explain the framework through the combined analysis of observational, physiological and performance data, two visualisations were made (Figures 3 and 4), one for each case study.
The intention was to show the observational (emotion and facial expressions), physiological (galvanic skin response and frequency-domain heart-rate variability), and performance data over time. (Apologies for the low accessibility of the visualisations, I created alternative texts for each figure which would help to explain them further.)
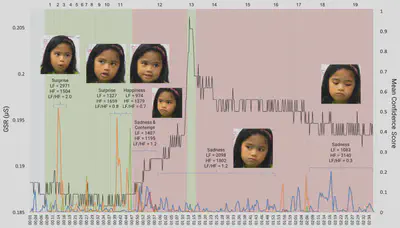
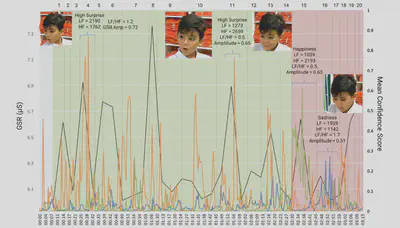
In both figures, the other coloured lines represent the confidence scores for emotions. Orange line represents surprise, green line represents happiness and blue line represents sadness. At the various confidence score peaks, we annotated:
- snapshots of the facial expressions
- the main inferred emotion
- heart-rate variability (HRV) values of low-frequency (LF), high frequency (HF) and LF/HF ratios - higher ratio, higher mental effort
Galvanic skin responses (GSR) are shown as black lines and measured in microSiemens. Usually, higher number of peaks and greater peak values indicate higher arousal/excitement. Performance trials of the cognitive tasks are numbered 1 through 19 or 20 at the top of the graph. The higher the trial number, the higher mental effort needed for the child to perform the task. The green and the red shaded regions represent correct and incorrect responses respectively.
Results
The framework can indeed help researchers and educators gain deeper understanding of learners’ cognitive-affective states via triangulation / combined analysis of observational, physiological and performance data.
Details of the framework, its application and our analysis of the case studies have been published in International Journal of Child-Computer Interaction (IJCCI 2019) and in IDC 2018 (refer to papers below). I highly encourage you to read the section titled: “Putting Them All Together: Triangulating Physiological, Performance and Behavioural Measures”, pages 44 to 46 of the IJCCI article and pages 259 to 261 of the IDC paper.
Samantha Chan
Postdoctoral Fellow
I create wearable, AI and digital interfaces to enhance human cognition and memory at the MIT Media Lab.