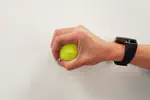
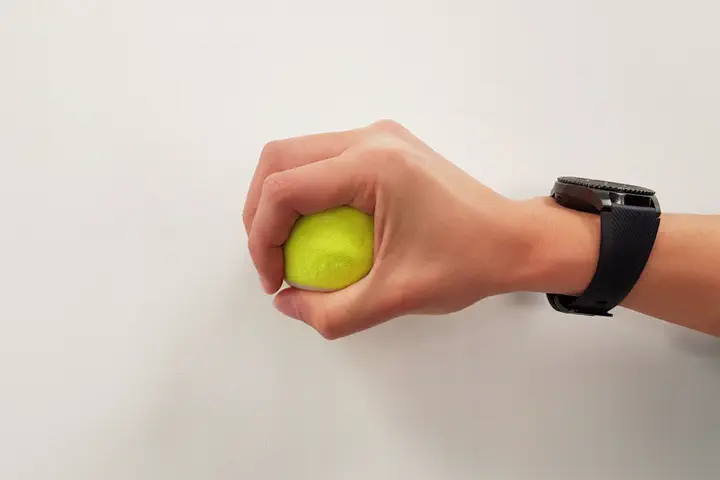
 User wearing smartwatch with fSense and grasping a tennis ball
Overview
fSense recognises the forces exerted during gestures using photoplethysmogram (PPG) or heart-rate sensors in smartwatches.
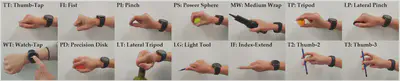
It can detect two levels of forces exerted (Soft or Hard) across 14 different gestures and grasps (see figure below) via a Random Forest classifier.
Role
I assisted the project lead, Thisum Buddhika, in conducting a user study to collect the PPG data and building the classifier. Our work resulted in a conference paper in Augmented Human 2019.
Process
Data Collection
PPG data was collected from 12 users who were asked to wear a Samsung Galaxy Gear 3 Frontier smartwatch. They performed the 14 gestures at 4 force levels (No force / Soft / Medium / Hard) for 3 times per gesture. Thus, each user performed a total of 14 x 4 x 3 trials = 168 trials. Each gesture took 1 to 2 seconds to perform. Each session was about 25 minutes.
Signal Processing and Feature Extraction
The PPG data was smoothed with an exponential moving average filter and the gradients of the signal were calculated. Statistical features of the mean, SD, min, max, median, skewness, kurtosis and RMS were extracted from the processed data in a sliding window of 20 data points (50% overlap).
Classifier
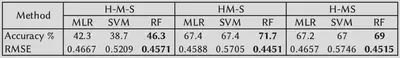
Three classification algorithms were compared: Support Vector Machine (SVM), Multinomial Logistic Regression (MLR) and Random Forest (RF). Initially, we intended to build a 3-class (Soft / Medium / Hard) force level classification system but our evaluation showed that it was more feasible to build 2-class systems (Hard+Medium/Soft, Hard/Medium+Soft).
The figure below summarises the classification accuracies and root mean squared error (RMSE) values from the evaluation. The RF algorithm was selected as it achieved higher accuracy and lowest RMSE compared to SVM and MLR.
Samantha Chan
Postdoctoral Fellow
I create wearable, AI and digital interfaces to enhance human cognition and memory at the MIT Media Lab.